The Role of Technical Analysis in Investment Decision Making
Technical analysis is a comprehensive method of evaluating securities that focuses on analysing statistical data generated by market activity, such as historical prices and trading volume. It aims to identify patterns, trends and support/resistance levels in price charts to make informed investment
Introduction
Technical analysis is a comprehensive method of evaluating securities that focuses on analysing statistical data generated by market activity, such as historical prices and trading volume. It aims to identify patterns, trends and support/resistance levels in price charts to make informed investment decisions. This article delves into the technical aspects of technical analysis and explores its relevance in modern financial markets.
Understanding Technical Analysis
Technical analysis is rooted in the belief that historical price and volume data can provide insights into future price movements. It employs various tools and techniques to analyse market data and predict potential price movements. These tools include chart patterns, indicators, oscillators and statistical models.
Key Concepts in Technical Analysis
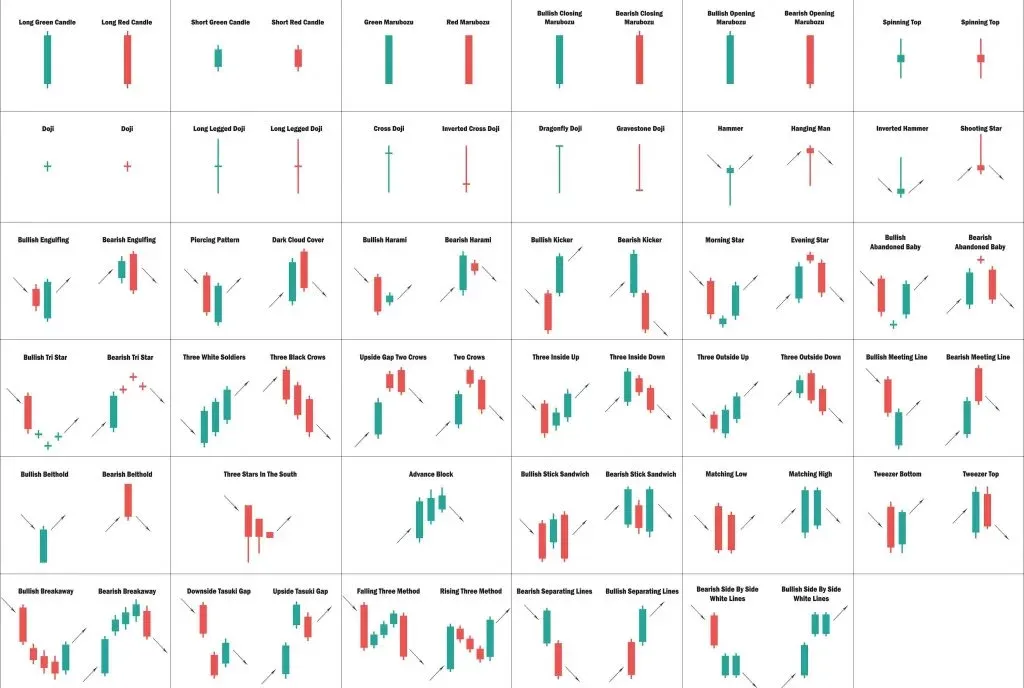
1. Chart Patterns
Chart patterns are recurring formations on price charts that offer valuable insights into market sentiment and potential future price movements. Technical analysts extensively study these patterns to identify potential trading opportunities. Some important chart patterns include:
- Head and Shoulders: This pattern indicates a potential trend reversal, with a peak (head) flanked by two smaller peaks (shoulders). It suggests that the existing trend is likely to reverse.
- Double Bottom/Top: This pattern suggests a potential trend reversal, with two consecutive lows (double bottom) or highs (double top). It indicates that the price has failed to break through a certain level in the past, potentially leading to a reversal.
- Ascending/Descending Triangle: These patterns indicate a potential continuation of an existing trend, with converging trendlines forming a triangle shape. The breakout from the triangle can provide insights into the future direction of the price.
2. Technical Indicators
Technical indicators are mathematical calculations based on price and volume data that help identify potential entry and exit points for trades. These indicators provide additional information about the market conditions and help traders make informed decisions. Some widely used technical indicators include:
- Moving Averages: Moving averages smooth out price data by calculating the average price over a specific time period. They help identify trends, support/resistance levels and potential reversal points.
- Relative Strength Index (RSI): RSI measures the strength and speed of price movements by comparing the magnitude of recent gains to recent losses. It identifies overbought and oversold conditions, signaling potential trend reversals.
- Moving Average Convergence Divergence (MACD): MACD combines moving averages to identify potential trend reversals and generate buy/sell signals. It calculates the difference between two moving averages and plots it on a chart.
3. Support and Resistance Levels
Support and resistance levels are price levels at which the market has historically shown a tendency to reverse or stall. Technical analysts use these levels to identify potential entry and exit points for trades. Support levels act as a floor, preventing prices from falling further, while resistance levels act as a ceiling, preventing prices from rising further. These levels are identified based on historical price data and are considered significant areas of supply and demand.
4. Statistical Models
In addition to chart patterns and technical indicators, technical analysis also incorporates statistical models to predict future price movements. These models utilise mathematical algorithms and historical data to generate forecasts. Some commonly used statistical models include regression analysis, time series analysis and neural networks. These models help investors make quantitative predictions about market behavior and assist in decision making.
Role of Technical Analysis in Investment Decision Making
Technical analysis plays a crucial and technical role in investment decision making by providing valuable insights into market trends, potential price reversals and optimal entry/exit points. Here are some key reasons why technical analysis is relevant in today's financial markets:
1. Identifying Trends
Technical analysis helps investors identify and capitalise on market trends. By analysing price charts, technical analysts can determine the direction of the market and align their investment strategies accordingly. They use various tools, such as moving averages and trendlines, to identify the strength and duration of a trend. This allows investors to ride the trend and potentially profit from price movements.
2. Timing Entry and Exit Points
Technical analysis helps investors determine optimal entry and exit points for trades. By identifying support and resistance levels, technical analysts can pinpoint when to buy or sell a security. They also use indicators like RSI and MACD to identify overbought and oversold conditions, indicating potential reversal points. This precision timing allows investors to maximise potential profits and minimise potential losses.
3. Risk Management
Technical analysis provides insights into the potential risks associated with an investment. By analysing historical price data and volatility indicators, technical analysts can assess the risk-reward ratio of a trade. They calculate measures like standard deviation and beta to quantify the level of risk involved. This helps investors make informed decisions and manage their risk exposure effectively.
4. Confirmation of Fundamental Analysis
Technical analysis can be used to confirm or complement fundamental analysis. While fundamental analysis focuses on evaluating a company's financials and industry outlook, technical analysis provides insights into market sentiment and short-term price movements. Technical indicators and patterns can validate or contradict fundamental analysis, providing a more comprehensive view of the investment opportunity.
5. Algorithmic Trading
With the advancement of technology, technical analysis has become an integral part of algorithmic trading systems. These systems use complex algorithms to analyse vast amounts of market data in real-time and execute trades automatically. Technical analysis plays a critical role in developing these algorithms by providing the necessary rules and signals for decision making.
Conclusion
Technical analysis plays a vital and technical role in investment decision making by providing valuable insights into market trends, potential price reversals and optimal entry/exit points. It helps investors identify and capitalise on market trends, time their trades effectively, manage risk and confirm fundamental analysis. By incorporating chart patterns, technical indicators, statistical models and algorithmic trading systems, investors can gain a competitive edge in today's complex financial markets. While technical analysis has its limitations and critics, its relevance and application continue to evolve as technology advances and market dynamics change.
Note: This article is for informational purposes only and should not be considered as financial advice. Always do your own research and consult with a qualified financial advisor before making any investment decisions.